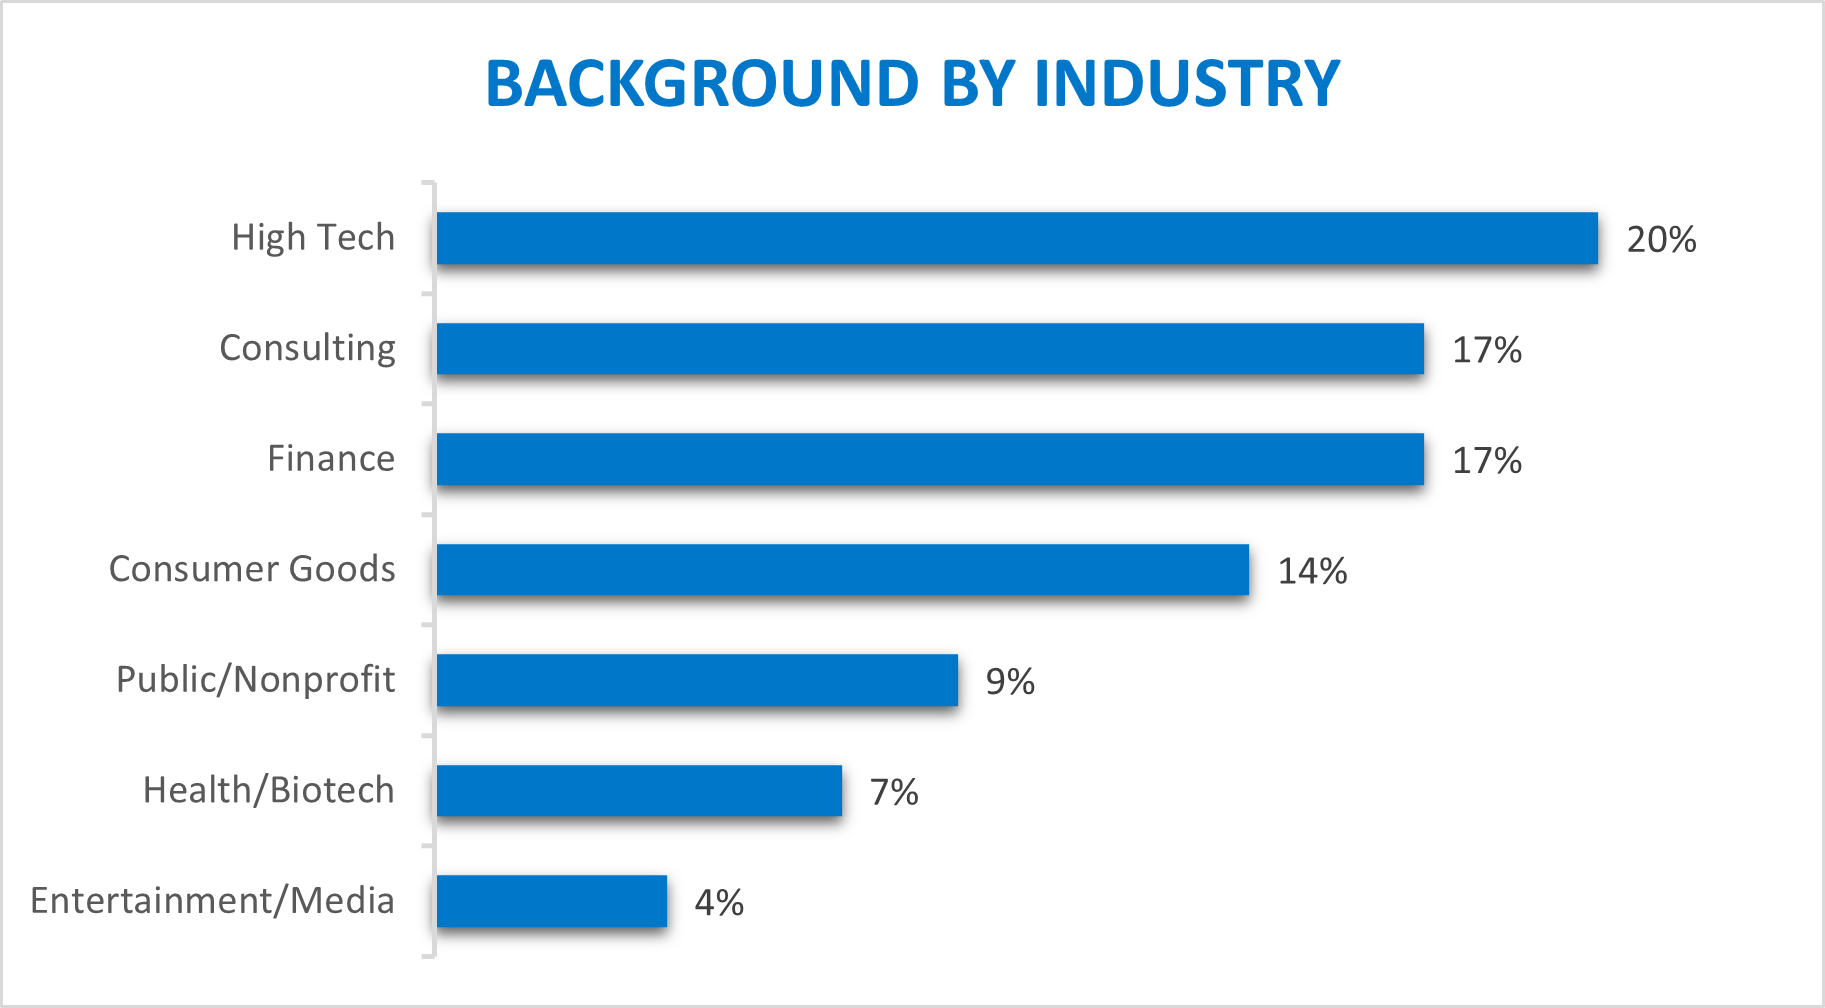
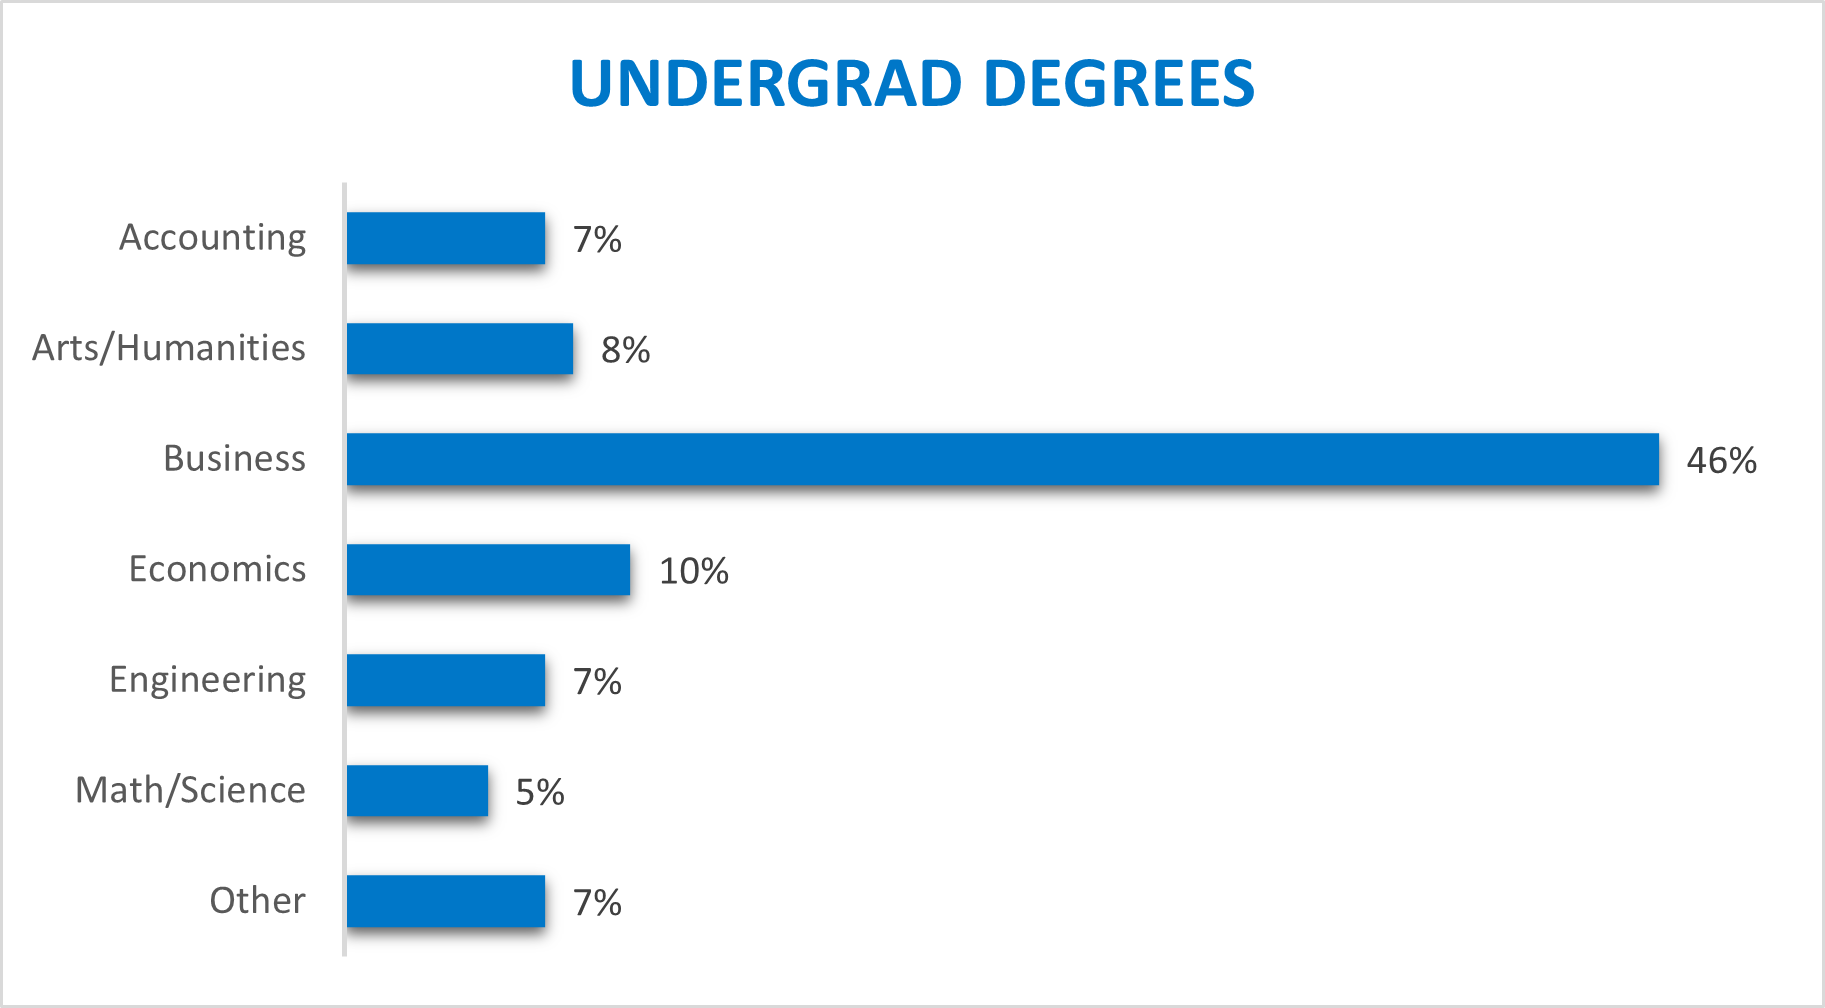
The BYU Marriott MBA program attracts students from a broad range of undergraduate institutions, states, countries, and backgrounds. Around 70 percent of students are bilingual. Here you’ll find an open, supportive, and highly collaborative learning environment.
Class of 2023
Size & Diversity
| Class Size | 99 |
| Women | 26% |
| International | 27% |
Academic Metrics
| Average GMAT | 668 |
| Average GPA | 3.5 |
BYU Marriott MBA Students
Click to read MBA student experiences at BYU Marriott
Gabrielle Cunningham
Current Company
Doctorate of Philosophy Candidate at University of Oxford
Internship
Research with professors Bingham, Sandholtz, and DeTienne
Previous Experience
Musical Theater Director and Director of Outreach for a Social Media and SEO Company
Undergrad
Acting
Home State
Texas
The MBA program at BYU has changed my view of the world and myself in a profound way. I never would have imagined falling in love with the study of organizational behavior. The people in an organization are to me like the characters in a play. How they behave and interact changes the outcome.
I’m now furthering my studies as a doctor of philosophy student at the University of Oxford.
I found that the BYU Marriott MBA program was a place I could thrive. The students and alumni were positive, professional, and empowering. It’s a place where camaraderie is as important as credentials, where building a community is a priority for students and faculty alike.
It was a tough two years, but the changes in perspective, the learning, the friendships, and the exposure to ideas have been invaluable to me and to my family.
Ryan Lundgren
Current Company
Dell
Internship
Dell
Previous Experience
Manufacturing Leadership Program at Avery Dennison
Undergrad
Supply Chain Management
Home State
Texas
I visited other MBA programs before choosing BYU Marriott and came away from those experiences feeling the programs were overpriced and overrated. My experience at BYU Marriott has been the exact opposite.
My classroom experiences gave me the skills I needed to be successful in my internship and land an amazing job. My MBA experience completely changed the direction and trajectory of my career. Not only did I land a great job, but the Sherpa program and recruiting process gave me a network to develop many more career opportunities in the future.
The culture, clubs, and extracurricular activities in the BYU Marriott MBA program set the stage for my long-term career—helping me build professional and personal friendships through serving others and adding value.
Christie Rasmussen
Current Company
PepsiCo/Frito Lay
Internship
ConAgra Foods
Previous Experience
Account manager for communications firm in SLC
Undergrad
Communications and Acting
Home State
Texas
I was hesitant to return to the same university where I got my undergrad degree. But it’s the caliber of the MBA program that matters, not just going somewhere else for the sake of resume diversity. The BYU Marriott MBA program competes with many of the top business schools but costs a fraction of the price. Going to BYU Marriott was incredibly enticing and impossible to turn down.
The BYU Marriott MBA program is large enough to have a strong presence in the business community, yet small enough to foster strong relationships in classes. The faculty are invested in students’ progress and constantly ascertaining what coursework is relevant to today’s business landscape.
The rigorous and thought-provoking classes prepared me for my career. The broad variety of experiences and work in teams stretched me as a student and helped me see my strengths.
Tyson Roger
Current Company
Cisco
Internship
Cisco
Previous Experience
Operations for Marriott Vacations Worldwide
Undergrad
Public Health Science
Home State
Arizona
Community is everything at BYU Marriott. First and foremost, the alumni network is incredible. Every person I reached out to made time for me. I was able to talk to senior leaders at multiple companies which allowed me to make valuable recruiting connections.
The campus experience is extraordinary, but the community doesn’t end there. During the summer, I was able to get facetime with multiple senior leaders due to alumni that were in my corner and wanted me to succeed.
My career has kicked into high gear as a result of my time in the BYU Marriott MBA program. I have had companies interested in me that wouldn’t have given me a second look before. It’s amazing what two years of school can do. I gained financial freedom—making three times my previous salary—and I’m able to make a larger impact both personally and professionally.
Alyssa Smith
Current Company
PMD Beauty
Internship
Intel
Previous Experience
Accountant for consulting firm; assistant controller for Marriott Vacations Worldwide
Undergrad
Accounting
Home State
Nevada
I initially considered attending a nighttime MBA program while working, but I quickly realized I needed to go full time in order to maximize my investment. Once I made that decision, BYU Marriott was really my only choice.
The network I built through the BYU Marriott MBA program helped me land my dream job—a role I thought I couldn't get without several more years of experience. I am forever indebted to the recommendations of my classmates in helping me land that role.
I can vouch that the recruiting opportunities are real. Whether it’s different industries, locations, cultures, or roles you are looking for, the BYU Marriott MBA program paves a path for you to determine what your ideal career is and gives you the tools you need to achieve it.
Kirk Steele
Current Company
Google
Internship
Google
Previous Experience
Sales and marketing for Hewlett-Packard and Ford Motor Company
Undergrad
Business Management
Home State
Utah
I chose BYU Marriott because I wanted to go into the tech industry, and a large percentage of BYU Marriott MBA grads go to work in tech. I was able to land an internship and job with Google.
In the BYU Marriott MBA program, I participated in several consulting projects for national companies as well as a local tech startup. The hands-on learning gave me the opportunity to apply the concepts I was learning in the classroom and develop the skills to excel in my career.
BYU Marriott professors are phenomenal: many of them have also taught in other top-tier MBA programs—Harvard, Stanford, and Wharton. They have produced groundbreaking research on innovation and leadership. I have also been extremely impressed by my classmates in the program. Everyone is very talented and driven to succeed, but at the same time willing to help each other out.
Landon Stoker
Current Company
Honeywell
Internship
DigitalGlobe
Previous Experience
Teacher
Undergrad
Weber State University, Integrated Studies: Chemistry, Health Administration, Zoology
Home State
Utah
I honestly do not know where I would be without the MBA program. The faculty and staff helped me see what is out there. They also helped me discover what I was good at. Students, including individuals from the Sherpa program, helped me refine my resume, hone my interview skills, and connect me with business professionals.
The culture of the BYU Marriott MBA program allowed me to participate in the learning process. The Learn, Do, Become program is a great example of this: I was able to play a significant role in its development.
Professors weren’t just teaching content but teaching students. Everyone is eager to help each other succeed. This same culture bleeds over to the alumni: they go out of their way to make sure you have what you need.
Shardae Tengberg
Current Company
Hilton
Internship
Hilton
Previous Experience
Event marketing on the Romney for President Campaign; event director and director of international affairs for Electric Run
Undergrad
Marketing
Home State
California
The BYU Marriott program increased my confidence and was the bridge to a world of new possibilities. Even though I knew BYU Marriott wasn’t known for recruiting in the entertainment industry, I knew I would be able to tap into the extensive BYU network to help me get where I wanted to go.
Coming from a non-traditional background prior to the MBA, I was not sure that my work experience was all that meaningful. One of the main things that BYU Marriott did for me was teach me how to talk about my past experience with employers—making it relevant to a Fortune 100 company.
I may be pretty biased here, but the MBA program events were pretty awesome. I say that in part because I helped plan them, but also because they help students get to know each other on a different level. We foster relationships that extend far beyond our two years in the program.


